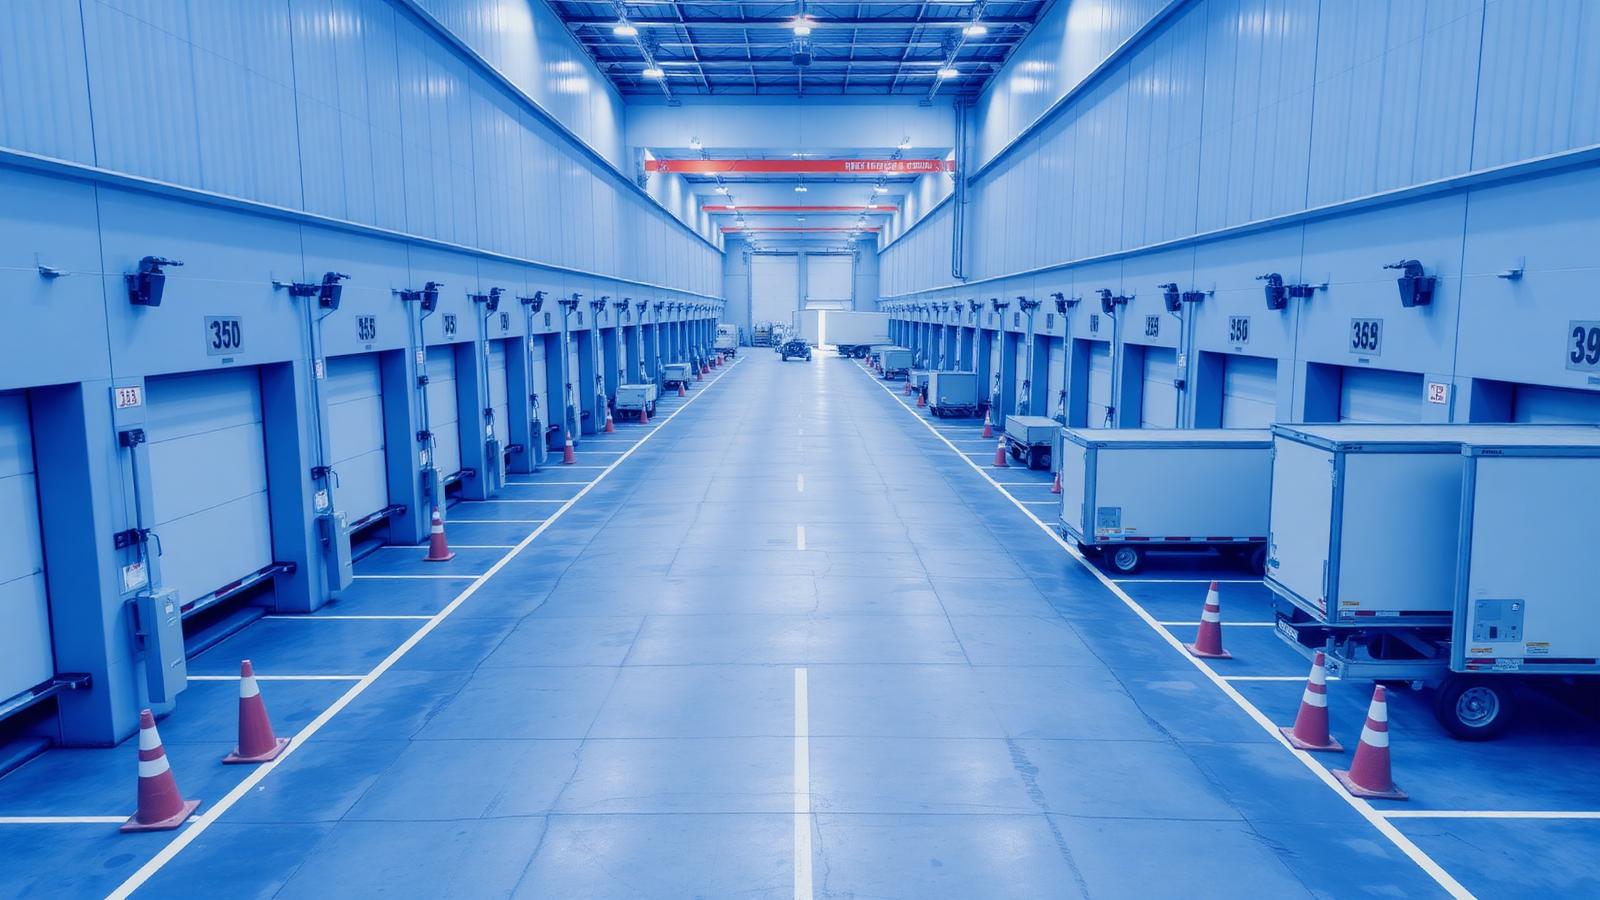

Most docks measure volume. Very few measure flow. These five metrics are the ones that consistently separate a well run dock from a chronic bottleneck, and every one of them can be instrumented with equipment you already own.
Rule of thumb: if a metric cannot be seen by a supervisor during the shift it describes, it is a reporting metric, not an operating metric. Operating metrics change behaviour, reporting metrics change slide decks.
1. Dwell time per door
The total time a trailer occupies a door, measured door by door rather than site wide.
- Why it matters: door hours are your real capacity constraint, not headcount or square footage.
- How to read it: track the median and the 90th percentile together. A stable median with a rising 90th percentile means you have a growing exception problem, not a systemic one.
- Common trap: averaging across all doors, which hides the two or three bays that are dragging the site down.
2. Idle share of dwell
The percentage of occupied door time with no active work happening on the trailer.
- Why it matters: it separates a labor problem from a capacity problem. High idle means your doors are fine and your coordination is not.
- Target: under 25 percent is achievable in most live-load operations. Many sites discover they are running above 50 percent.
- Common trap: assuming idle time is driver-caused. Post-work idle, where the trailer is finished but nobody has released the door, is usually the bigger slice.
3. Detention exposure rate
The percentage of trailers that exceed the carrier's contractual free time, plus the total billable minutes beyond it.
- Why it matters: it converts an operational metric into a financial one your finance team already cares about.
- How to read it: segment by carrier. Detention is rarely evenly distributed, and one or two partners typically drive the majority of the charges.
- Common trap: only counting invoiced detention. Uninvoiced detention still costs you goodwill and future capacity pricing.
4. Door utilisation
The percentage of operating hours each door is productively occupied.
- Why it matters: it is the metric that tells you whether you need more doors or better sequencing. Almost always it is the latter.
- How to read it: plot by hour of day. A site with 60 percent daily utilisation and 100 percent between 9am and noon does not have a capacity problem, it has a scheduling problem.
- Common trap: counting occupancy as utilisation. An idle trailer occupies a door without utilising it.
5. Turn time by carrier and freight type
Gate in to gate out, segmented so you can compare like with like.
- Why it matters: it is the number your carriers use to price you. Sites with reliable turn times get better rates and better capacity in tight markets.
- How to read it: consistency beats speed. A predictable 90 minutes is worth more to a carrier than an unpredictable 60.
- Common trap: comparing floor loaded and palletized freight in the same bucket, which makes every conclusion meaningless.
| Metric | Review cadence | Primary owner | Acts on it |
|---|---|---|---|
| Dwell per door | Live and daily | Dock supervisor | Shift lead |
| Idle share | Daily | Operations manager | Labor planner |
| Detention exposure | Weekly | Transportation | Finance and carrier reps |
| Door utilisation | Weekly | Site manager | Scheduling |
| Turn time | Monthly | Site manager | Carrier management |
Instrumenting without new hardware
Every metric above needs the same four events: trailer arrived at door, work started, work finished, trailer departed. Capture those four reliably and all five KPIs fall out of the same data set. That is precisely what camera-based dock monitoring does with the equipment already mounted above your doors.
Key takeaways
- Four reliable events produce all five KPIs, so instrument once and report everywhere.
- Segment everything by door, carrier and freight type or the numbers will mislead you.
- Idle share is the fastest route from measurement to a real operational change.